
These are some visualization dashboard projects i have embarked on.
They document my skills in analyzing data and presenting their insights in easy to digest visuals.
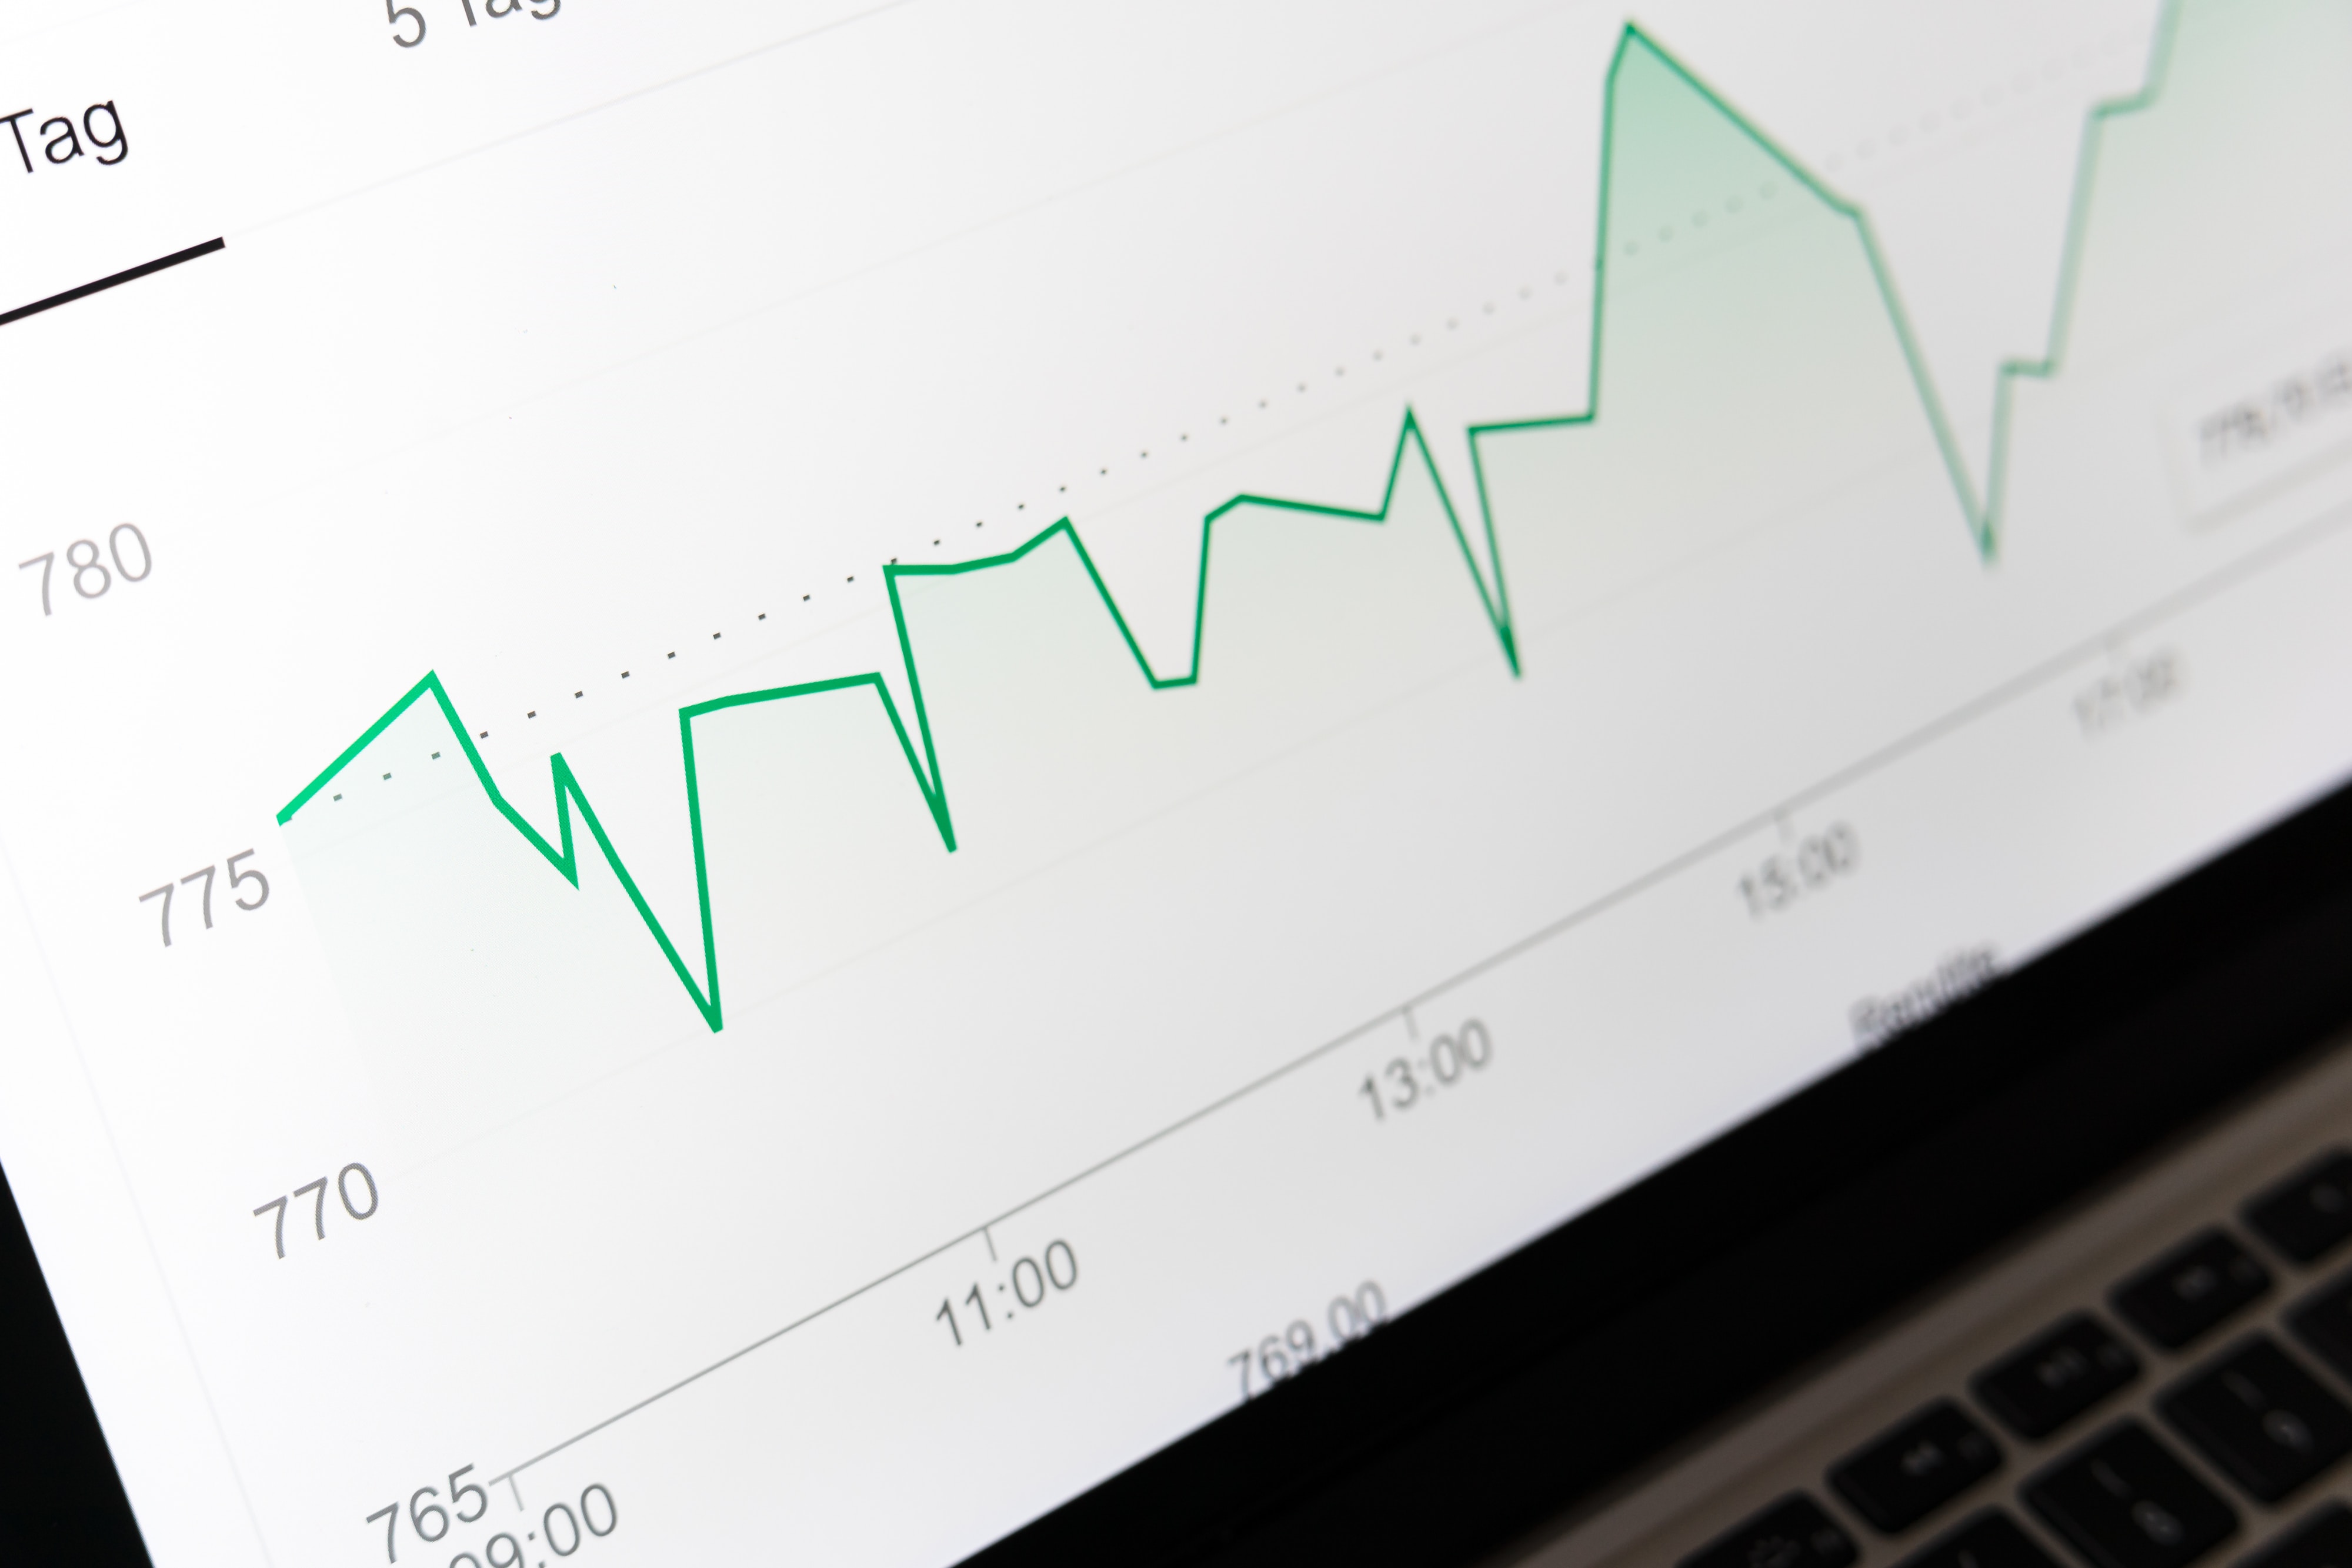
Tata Sales Analysis Dashboard
This dashboard explores four questions the CMO and CEO wanted answered from the organization's sales data.
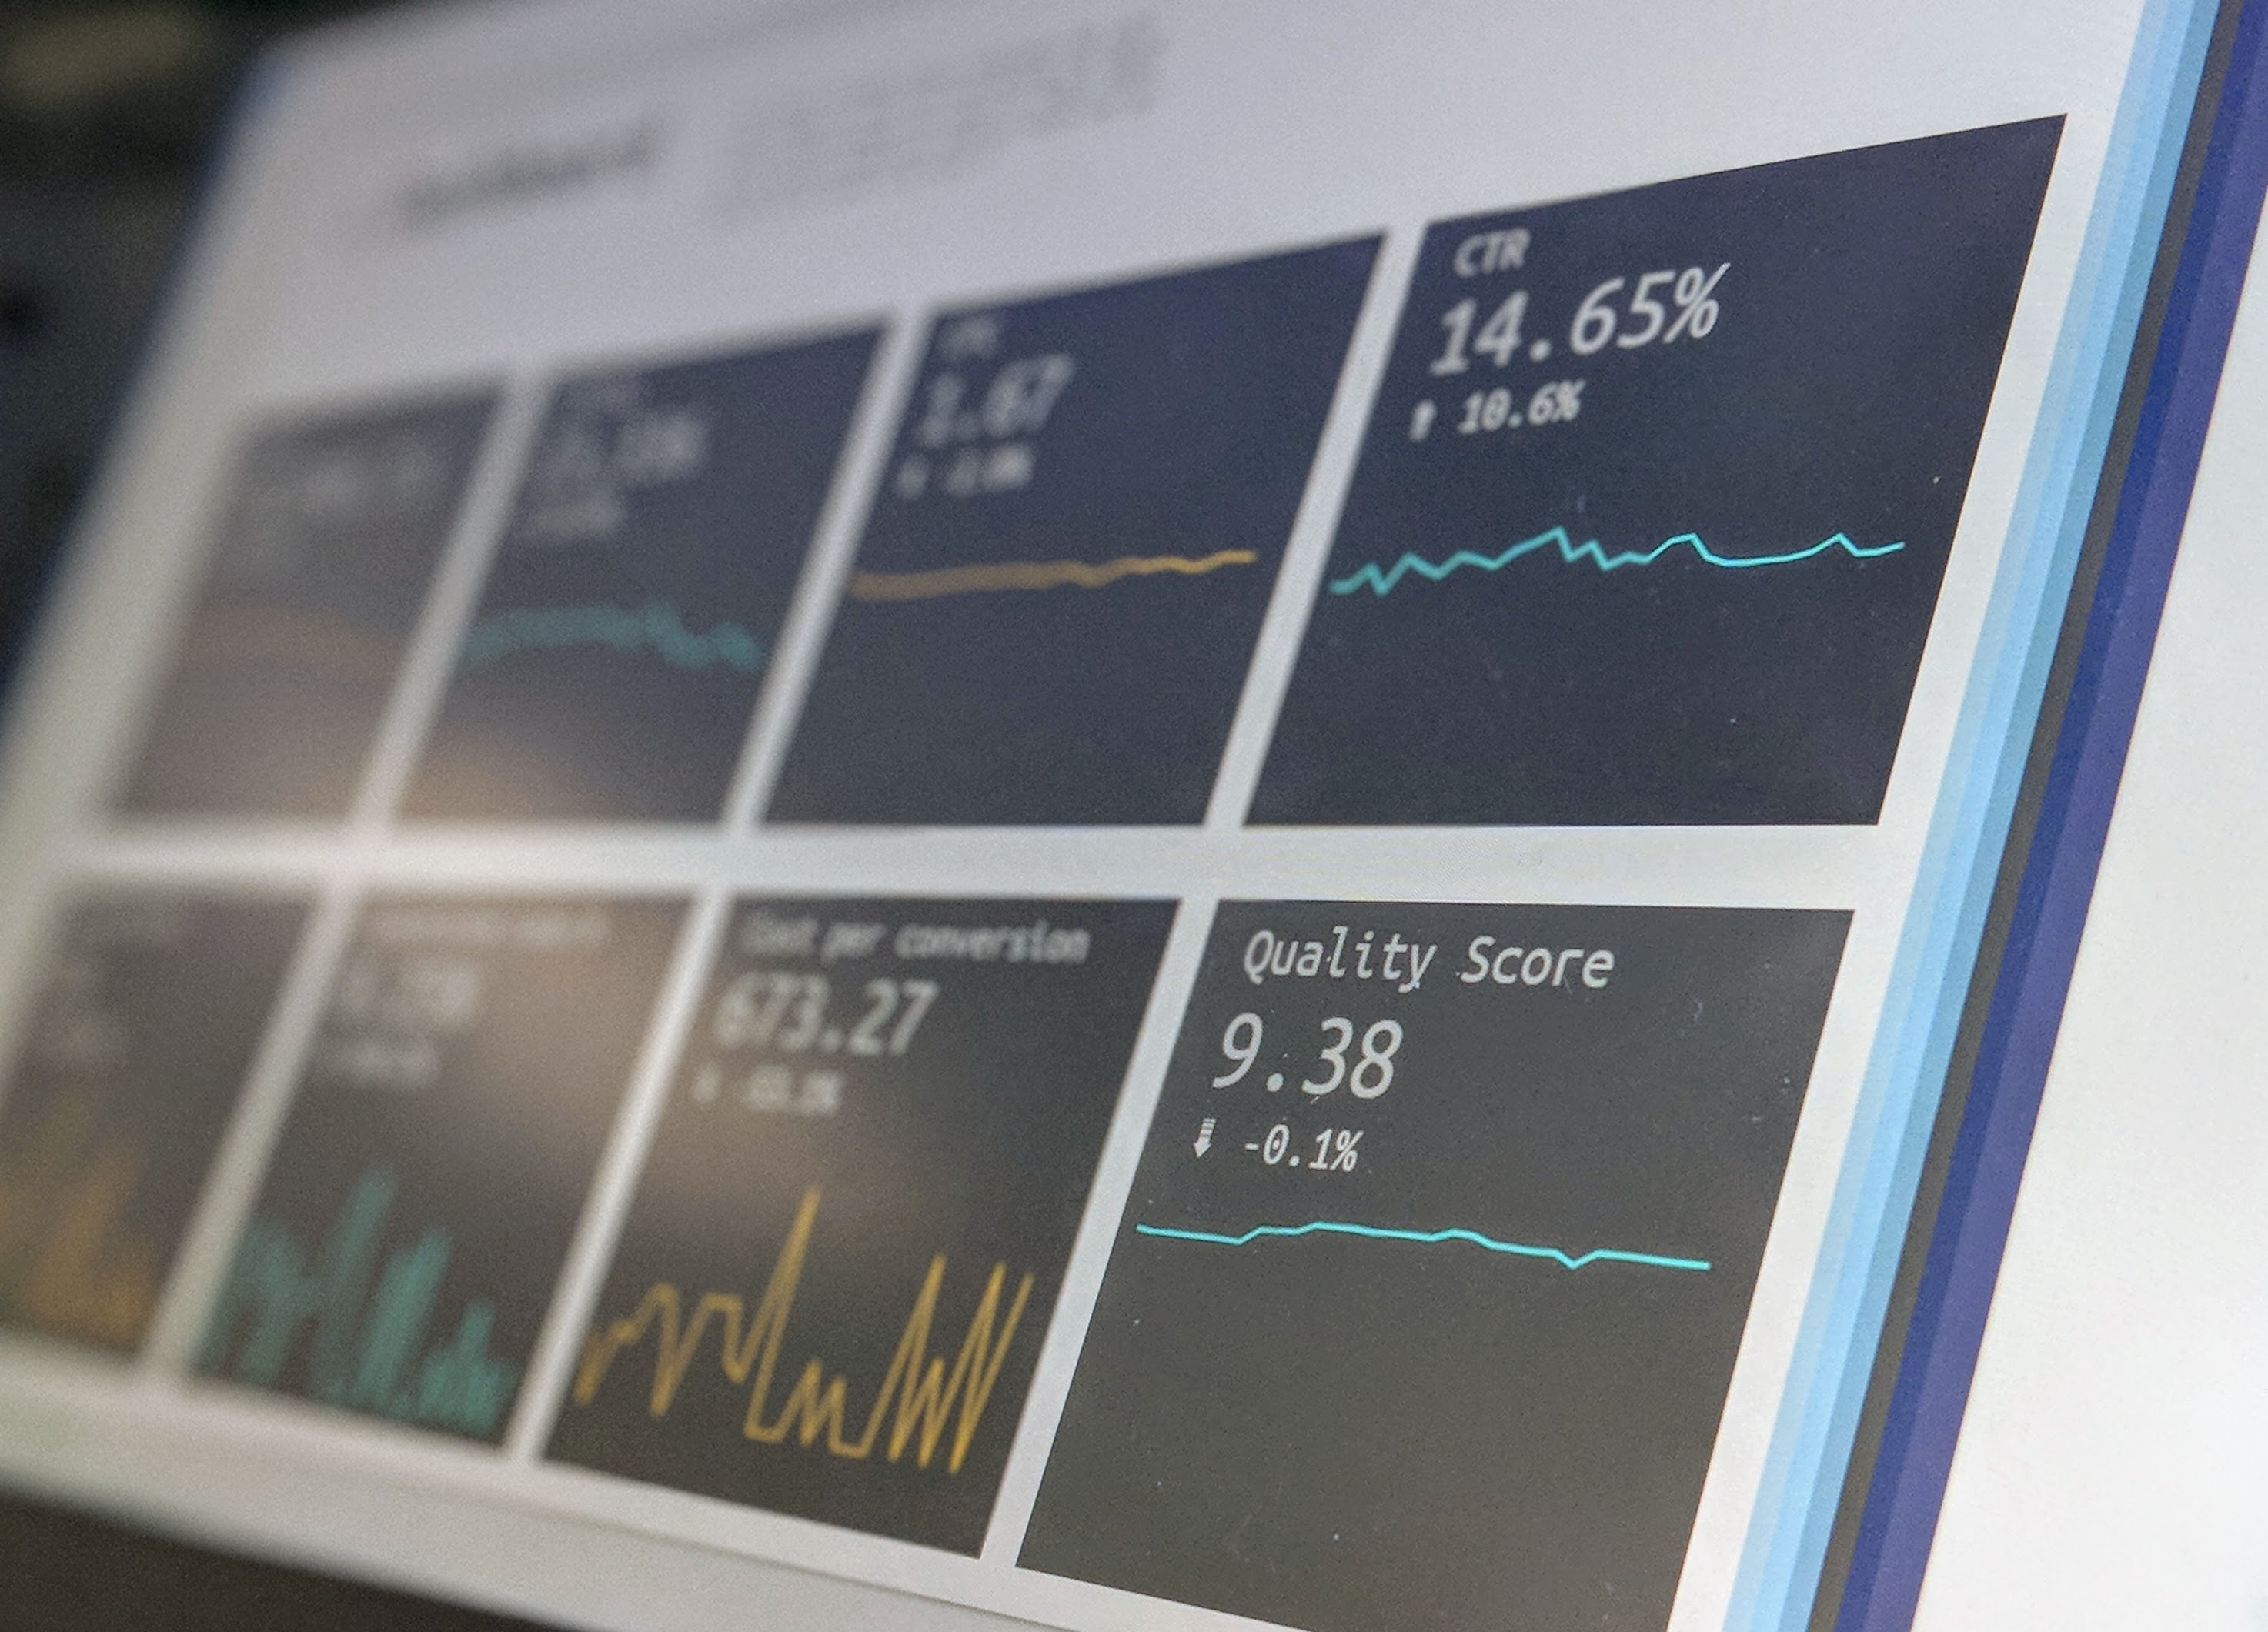
KMS Order Table Analysis
KMS is an online store. An analysis of their data was made to determine their profit, sales and order quantity by Province.
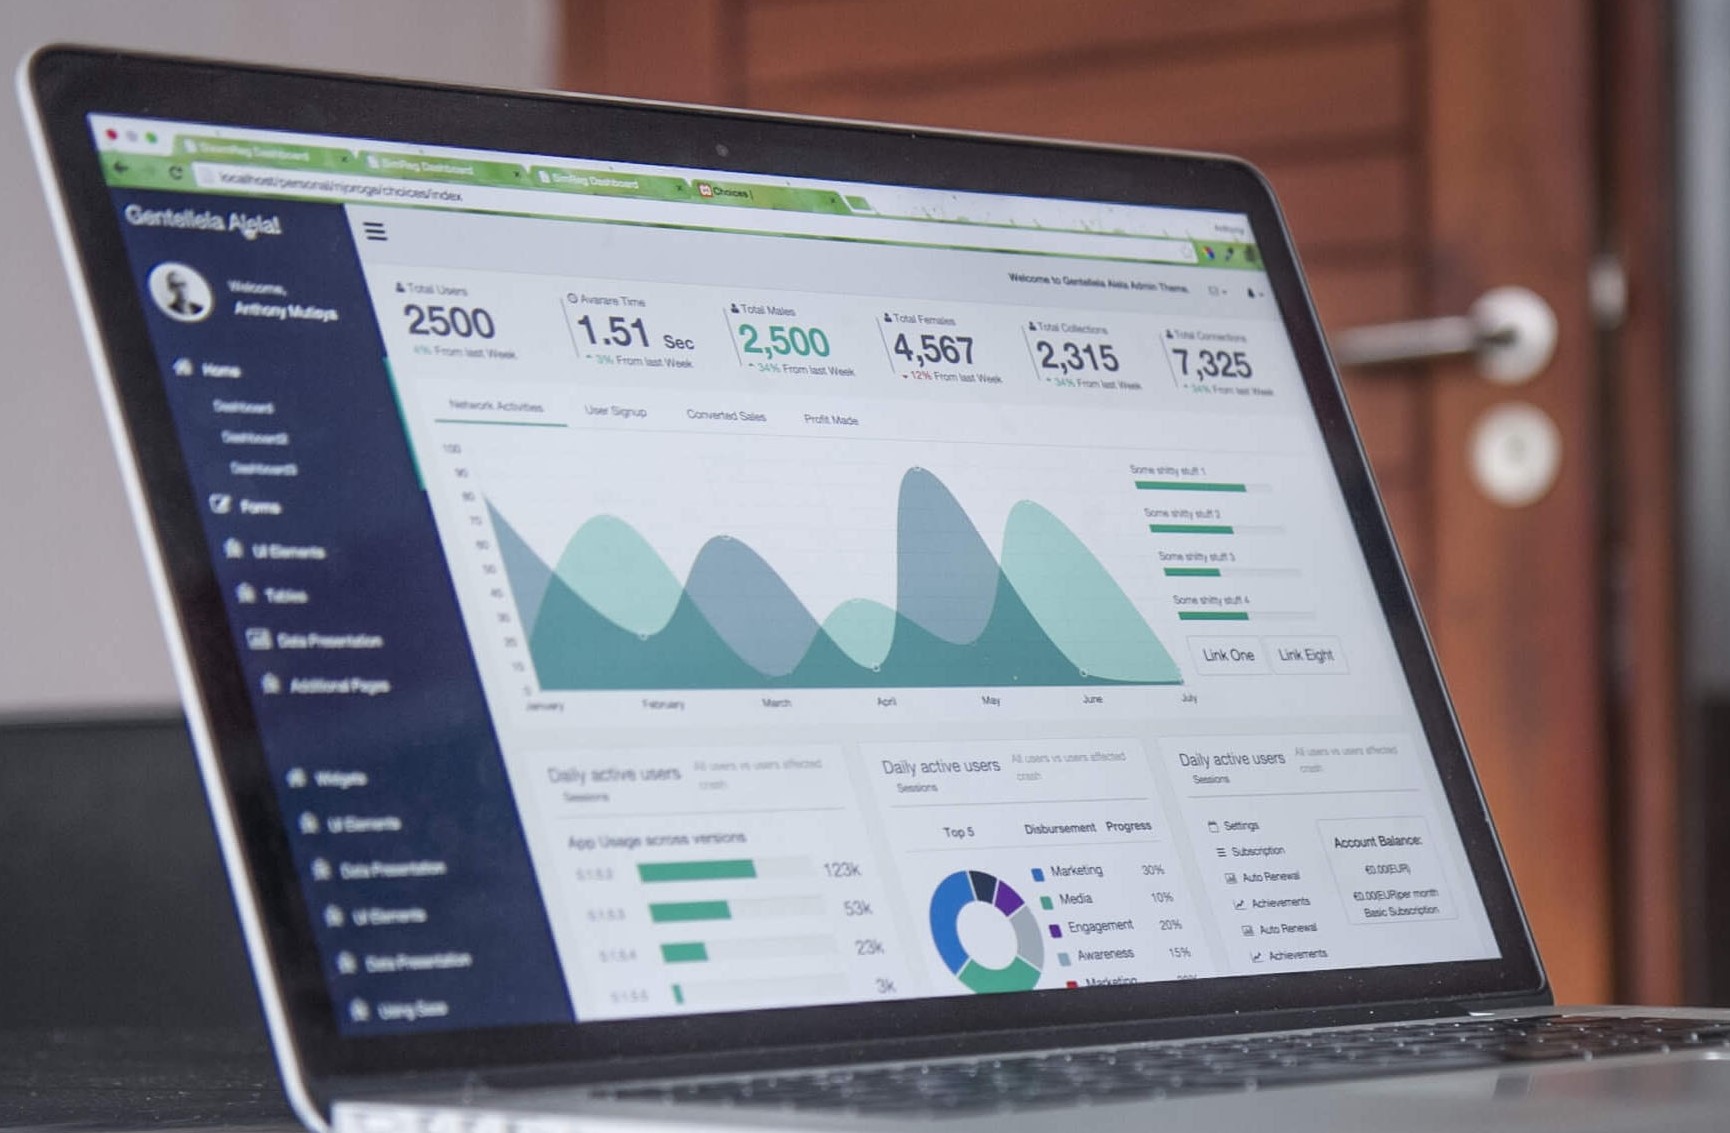
Super Store Dataset Dashboard
This dashboard report explores the Total Sales,Total Sales profit and the number of Unique Customers of the Super Store.
The profits realized by every Region and Product Category was also visualized.
Power BI Visualizations
Most often a Data Analyst is required, as per the demands of their work, to present insights in conscise, interactive dashboards. Power BI is a powerful suite of applications that fulfill exactly that need. Below is a link to insightful dashboards I have prepared using Power Bi.